Language
Labels, scripts, titles, legends.
WORLD DESK // 03
research index ↙IEEE TVCG · MANUSCRIPT IN PREPARATION
When a chart crosses a language boundary, what exactly has to travel with it?
I study how people interpret, explain, and recreate visualizations across linguistic and cultural contexts. Rather than treating localization as text translation alone, this work examines how people reason about notation, layout, visual convention, and what should change when a chart is adapted for another audience.
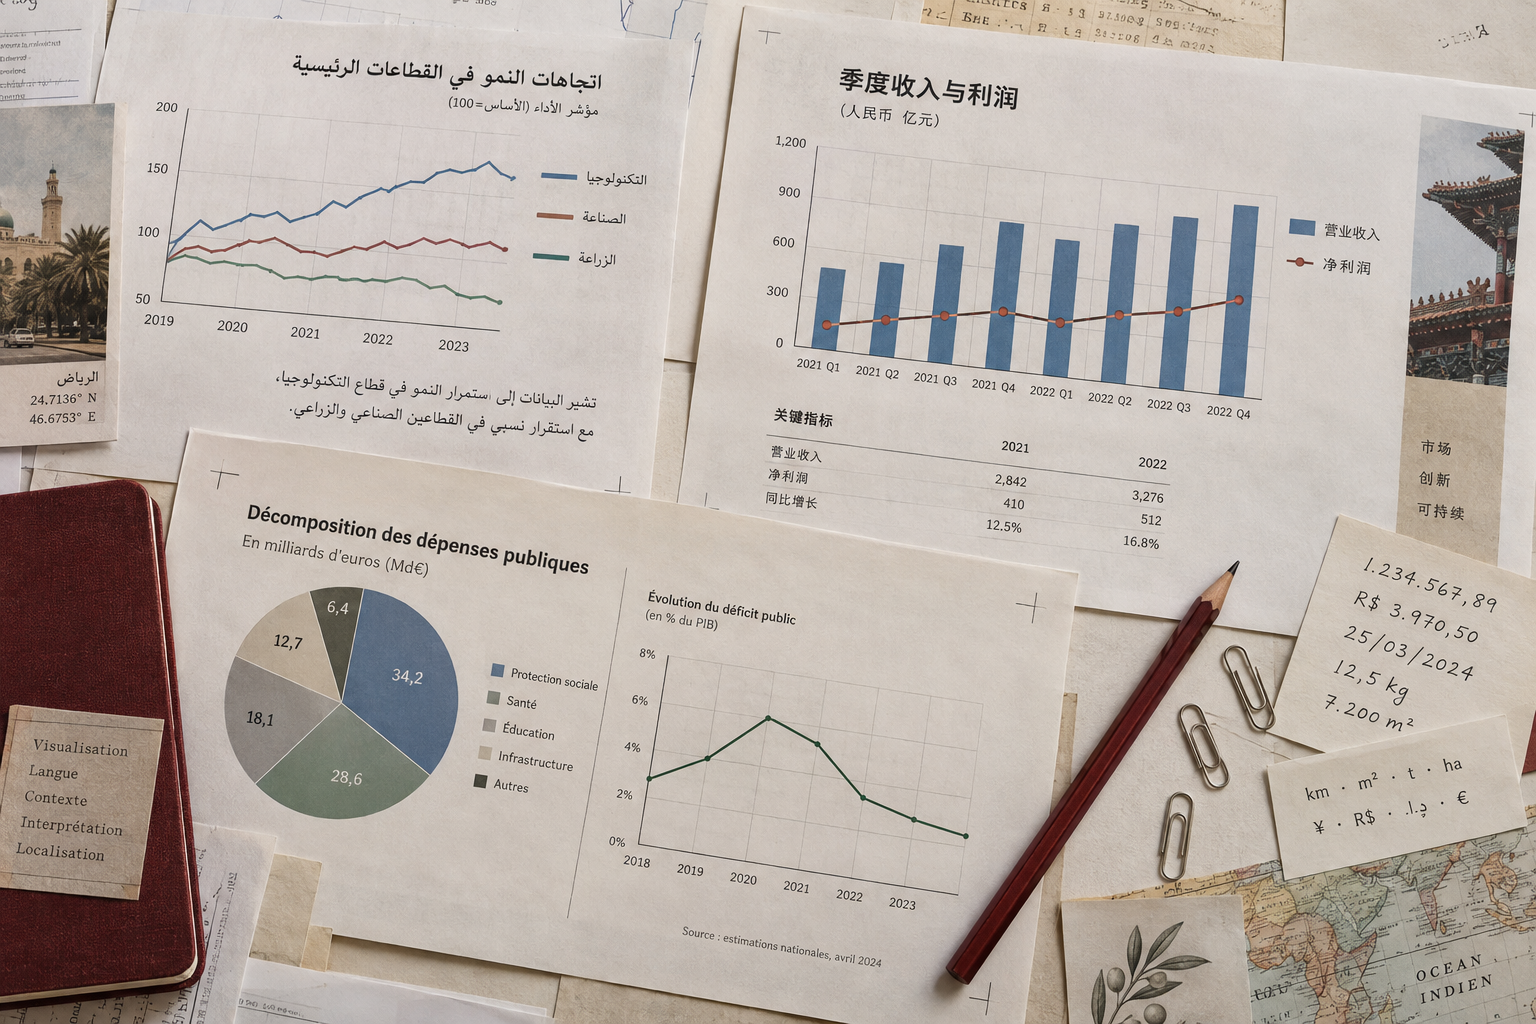
because apparently charts also have accents
research brief // 03
from encounter to redesign
The study follows what happens as a person moves from simply encountering an unfamiliar chart to communicating and ultimately redesigning it for someone else.
Participants first make sense of an unfamiliar visualization and its data, labels, notation, and conventions.
They explain the chart for another audience, revealing what information they preserve, omit, translate, or reinterpret.
They adapt the chart for a new audience, making explicit decisions about language, notation, layout, and visual semantics.
language · numeric notation · dates + units · layout + direction · color semantics · tool use
layers of localization
Labels, scripts, titles, legends.
Numbers, dates, currencies, units.
Reading direction, axis placement, color meanings.
Search, translation systems, generative AI, and other ad-hoc assistance.
Localization becomes interesting precisely because these layers do not always travel together.
contribution ledger
Designed a participant-study structure that separates interpretation, explanation, and recreation rather than treating visualization understanding as a single task.
Developed chart tasks that expose different kinds of locale-dependent reasoning while still allowing participants to work naturally with external tools.
Built a structured coding scheme for participant responses, awareness of locale-specific conventions, and tool-use behavior.
Designed evaluation criteria for participant-created visualizations so that language, notation, visual convention, fidelity, and completeness can be assessed separately rather than collapsed into one accuracy score.
Structured the study so that participant behavior, produced artifacts, tool use, and workload can be analyzed together.
the interaction question
Visualization localization is usually framed as a translation problem.
But people interact with charts through learned conventions: how numbers are grouped, where axes appear, what colors imply, which direction information is read, and which tools they trust when something feels unfamiliar.
This project studies that interaction between people, visual conventions, and the tools used to bridge unfamiliarity.
The broader design question is not simply “can we translate this chart?” but: what should a visualization system preserve, explain, adapt, or redesign when meaning depends on locale?
working premise
Localization is not only translation. It is a design decision about what meaning needs to travel.
open questions
apparently the bars are universal. everything around them has opinions.
methods
participant study · task design · visualization evaluation · structured coding · human evaluation · tool-use analysis · workload measurement · cross-cultural HCI
This work began as an IEEE VIS short-paper submission. Reviewer feedback encouraged us to develop the study more substantially, so we are extending it into a fuller manuscript for IEEE Transactions on Visualization and Computer Graphics (TVCG).
The extended version deepens the participant study, coding framework, and analysis across interpretation, explanation, and recreation.
the short paper acquired ambitions.
full research index ↓